They will save (or make money) by providing 24 hours/7 days a week customer service availability.
AI-powered Chatbots are virtual assistants.
AI Chatbots can free human customer service resources by acting as a filter for common inquiries from customers.
Their impact on business day-to-day operations is undeniable.
Chatbots provide the possibility of saving costs and providing true 24/7 customer service.
We would be delighted to will help you leverage these tools that were once only available to a select group of big corporations – to help you deliver the best customer experience and help you remain competitive, adaptable, and innovative.
Virtual Assistants will help you to innovate and improve productivity in your team.
The process is simple:
We work with you to ask the right questions, analyze the challenges you are facing, and zero in on your priorities.
Then we develop your own AI Chatbot.
Our goal is to help our customers become the front runners and pacesetters – regardless of their current size and industry.
Discover How AI Chatbots Can Impact Your Organization!
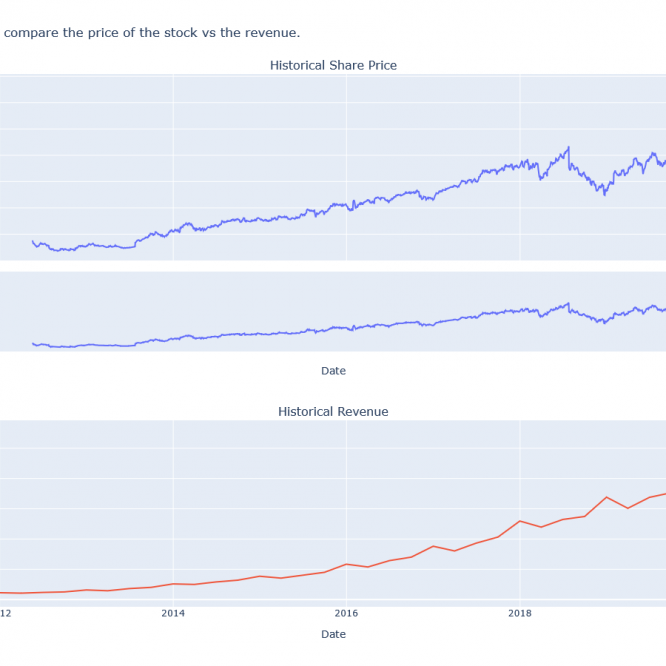
Python has a simple and easy to use web scraping technique to extract revenue and stock price data from any stock on the stock market,
In this instance, we can create a dashboard from historical Facebook data to compare the price of the stock vs the revenue of Facebook.
This easy to create dashboard will not only provide information about the revenue and stock price but it will allow us to see if there is a correlation between the two.
Did you know that Facebook acquired the domain facebook dot com for $200,000 in August 2005?
If you have questions please do not hesitate to contact us
The total population of the world has reached 7.8 billion people.
World Population 2020. *source: UN
Is World Population Growing?
World population has increased according to the official United Nations population estimates and projections.
World population growth increasing year on year.
The dataset is prepared by the Population Division of the Department of Economic and Social Affairs of the United Nations Secretariat (UN).
World Population 1950-2020. *source: UN
Global population is predicted to be 8 billion by the year 2023.
The UN data on world population is a great source of data for a world population review.
The dataset contains annual figures from the past and current world population numbers, starting from 1950 to 2020, as recorded by the United Nations.
The UN dataset also provides annual estimate figures on future global population, with different variants with one showing how global population increasing to potentially over 21 billion people for the world population 2100.
Can the population growth estimates, which include 9 variants orpossible outcomes, predict what future world population could be?
World Population 2100.
World Population 2020-2100. *source: UNWorld Population 2020-2100. *source: UN
Earth Population Today.
It is clearly visible from the world population graph below that Asia and Africa is a major contributor to the earth population.
Asia populationestimates show over 4.6 billion people which is 59.9% of the global population and followed by the population of Africa with 1.3 billion.
Africa and Asia account for 77.2% of the world population with a combined figure of almost 6 billion people.
World Population 1950-2020. *source: UN
World Population Regions 1950-2020. *source: UN
World Population Regions 1950-2020. *source: UN
World Population Regions 1950-2020. *source: UN
World Population Asia and Africa 1950-2020. *source: UN
World Population Regions 1950-2020. *source: UN
2 Most Populated Countries.
The 2 most populated countries are India and China. China is the most populated country in the world.
The following data visualization of UN datasets shows the 2 most populous countries India and China represent a major part of world demographics.
China is the largest country in the world by population with a current population estimated over 1.4 billion people.
India ranks second in world population by country with an estimated population of just under 1.4 billion people.
The 2 most populated countries India and China have an estimated combined total population of over 2.8 billion people.
India and China, being the largest countries by population and having a total population of over 2.8 billion people, represents 36.4% of the earth population.
As per the chart below, the title for the most populated country is being challenged by India with a rise in population to 1,380,004,000 catching up to China’s 1,439,324,000 people.
China and India population Growth (1950-2020)
China and India Population Growth (1950-2020)
China and India Population Growth (1950-2020)
China and India Population Growth (1950-2020)
Is World Population Decreasing?
Is world population decreasing, is the world population declining? The answer in short is no. Not at the moment.
World population isn’t decreasing or declining as shown by the figures from the United Nations dataset.
Global population will steadily increase up to around the year 2050.
World Population Increasing 2020-2054. *source:UN
Why World Population Will Decrease?
Will world population decrease?
The United Nations dataset has variants of world population between 2020 and 2100, with different variants for future population predictions.
Of the 9 different variants, 3 variants predict world population could decrease from approximately around years (a) 2054, (b) 2066 or (c) 2074, according to the UN dataset.
The 3 variants predict population starting to decrease approximately around the 9 billion mark with decreases approximately between 33 million between 2074-2100, 581 million between 2066-2100 and 1.6 billion between 2054-2100.
World Population Decreasing 2020-2100. *source:UN
But the question remains to be seen, will world population decline when the other remaining 6 UN variants showing world population increasing?
World Population Increasing 2020 -2100. *source: UN
Why World Population Is Growing
The UN dataset shows how world population has increased and what world population today or now was, it will only have increased year on year.
The world population by year datasets show global population growth will continue just as world population has been increasing since UN records began.
It is estimated by the United Nations that the world population 2030 could have reached 8.5 billion and world population 2040’s could reach 10 billion people on planet earth.
Next time, we’ll explore further with more analysis and data visualization of the UN dataset, discoveringmore about world population increasing, and the top 10 most populated countries.
Please subscribe below to get the latest insights.
To find out more about how Integrate Data Science can work for you with your next data-driven projects, please be sure to contact us via the contact form at the end.
The U.S. Bureau of Economic Analysis released data for the United States GDP Growth reporting that US real gross domestic product (GDP) increased at an annual rate of 33.1 percent in the third quarter of 2020. In the second quarter, the United States real GDP growth decreased 31.4 percent.
America’s GDP Growth Rate
BEA reported that the increase in third quarter GDP reflected continued efforts to reopen businesses and resume activities that were postponed or restricted due to COVID-19.
Retail Sales figures from multiple countries were released in the past few days including Mexico, Russia, South Africa, Poland, Taiwan, Denmark, United Kingdom, Canada and New Zealand (NZ).
With the coronavirus pandemic impacting on all Retail Sales, newly released data shows that many countries could bounce back after the lockdown restriction.
This week saw the release of GDP Growth figures from two countries that are amongst the world’s most important transportation hubs – Singapore and Germany. The data released by Statistics Singapore and Statistisches Bundesamt (Destatis) shows the GDP Growth Q3 2020 for Germany and Singapore.
Gross Domestic Product Growth
Gross Domestic Product YoY: Q3 2020 – Germany YoY was -4.0% on the same quarter a year earlier
– Singapore YoY was -5.8%
Gross Domestic Product QoQ: Q3 2020
– Germany QoQ was +8.5% on the previous quarter
– Singapore QoQ was +9.2%
Both countries has seen a big impact on their GDP growth affected by the coronavirus pandemic but the latest figures suggest that both countries could bounce back.
The Ministry of Trade and Industry Singapore said that their economy is projected to grow by “4.0 to 6.0 per cent” in 2021 and that the recovery of the Singapore economy in the year ahead is expected to be gradual, and will depend to a large extent on how the global economy performs and whether Singapore is able to continue to keep the domestic COVID-19 situation under control.
Germany’s economy is the fifth largest economy in the world and is Europe’s largest with its leading exporter of machinery, vehicles, chemicals, and other equipment with the exports of Germany’s goods and services accounting for nearly half of its GDP.
Source: [Contains information from {The Ministry of Trade and Industry (MTI) dataset} accessed on {23 November 2020} from {Statistics Singapore} which is made available under the terms of the Singapore Open Data Licence version 1.0 {Singapore Open Data Licence }]
Statistisches Bundesamt (Destatis) reported that the Germany GDP Growth Rate rose by 8.5% in the third quarter of 2020 compared with the second quarter of 2020 after adjustment for price, seasonal and calendar variations.
However, the price-, seasonally and calendar-adjusted GDP was still 4.0% lower in the third quarter of 2020 than in the fourth quarter of 2019, that is the quarter before the global coronavirus crisis.
Germany Gross Domestic Product GDP
– YoY was -4.0% on the same quarter a year earlier (price- and calendar-adjusted)
– QoQ was +8.5% on the previous quarter (price-, seasonally and calendar-adjusted)
Data released by Germany’s The Federal Statistical Office (Destatis) data indicated the growth rate year on year for Germany is -4%. Although the figure sits in the contraction zone, it is an improvement from previous of -11.3% giving signals that the German economy could be bouncing back after the coronavirus pandemic..
Data release Monday the 23rd of November from the Markit Manufacturing PMI (data known as IHS Markit’s The Manufacturing Purchasing Managers Index which measures the performance of the manufacturing sector) revealed to be 57.9, slightly down again from last report of 58.2, but was still enough to be the leader in manufacturing and above both the US and the UK which both having had expansions in the last 2 PMI’s.
Germany’s economy is the fifth largest economy in the world and is Europe’s largest with its leading exporter of machinery, vehicles, chemicals, and other equipment.
Exports of Germany’s goods and services account for nearly half of its GDP.
MTI reported that the Singapore economy expanded by 9.2 per cent on a quarter-on-quarter seasonally-adjusted basis in the third quarter, a turnaround from the 13.2 per cent contraction in the second quarter.
The report also stated that on a year-on-year basis, the economy contracted by 5.8 per cent, moderating from the 13.3 per cent contraction recorded in the previous quarter.
The Ministry of Trade and Investment Singapore (MTI) said that the improved performance of the Singapore economy came on the back of the phased resumption of activities in the third quarter following the Circuit Breaker that was implemented from 7 April to 1 June 2020, as well as the rebound in activity in major economies during the quarter as they emerged from their lockdowns.
Singapore Economy Projected to Grow
The Ministry of Trade and Industry Singapore said that their economy is projected to grow by “4.0 to 6.0 per cent” in 2021 and that the recovery of the Singapore economy in the year ahead is expected to be gradual, and will depend to a large extent on how the global economy performs and whether Singapore is able to continue to keep the domestic COVID-19 situation under control.
Source: [Contains information from {The Ministry of Trade and Industry (MTI) dataset} accessed on {23 November 2020} from {Statistics Singapore} which is made available under the terms of the Singapore Open Data Licence version 1.0 {Singapore Open Data Licence }]*
Monday the 23rd of November: Release of data from the Markit Manufacturing PMI for France, Germany, European Union, United Kingdom and the United States of America.
Markit Manufacturing PMI
Released monthly, in advance by IHS Markit the PMI data known as The Manufacturing Purchasing Managers Index measures the performance of the manufacturing sector and its data is derived from a survey of top industrial companies and based on 5 indexes with a total weight of 100%.
A figure above 50 indicates an expansion of the manufacturing sector while a figure below 50 represents a contraction.
Stats NZ has released figures showing New Zealand Retail Sales recovery in the September 2020 quarter.
For the September 2020 quarter compared with the September 2019 quarter the total value of NZ Retail Sales (with price effects included) rose 7.4 percent ($1.8 billion) and the total volume of retail sales rose 8.3 percent
New Zealand Retail Sales Values Rise
Stat NZ said retail sales values recorded its largest September quarter rise since the series began in 1995.
Furthermore, spending on major household items, vehicles, and groceries contributed to the strong rise in total retail sales compared with the September 2019 quarter.
The report stated this quarter’s rise indicates a recovery for retail businesses, but it does not make up for the historic fall of 15 percent ($3.6 billion) in the COVID-19-affected June 2020 quarter.
New Zealand Retail sales report provides an aggregated measure of sales of retail goods and services over a specific time period.
Sales values boosted by motor vehicles and supermarkets
Twelve of the 15 industries had higher sales values in the September 2020 quarter compared with the September 2019 quarter.
With price effects included, the main movements by industry were:
motor vehicle and parts retailing, up 13 percent ($454 million)
supermarket and grocery stores, up 8.4 percent ($429 million)
hardware, building, and garden supplies, up 16 percent ($352 million)
electrical and electronic goods retailing, up 25 percent ($232 million)
department stores, up 12 percent ($147 million)
recreational goods retailing, up 20 percent ($115 million).
Fuel retailing had the largest fall, down 8.1 percent ($176 million), followed by accommodation, down 12 percent ($110 million).
Source: Statistics New Zealand, Retail trade survey: September 2020 quarter, November 23, 2020. Reproduced and distributed on an “as is” basis with the permission of Stats NZ.
The European Commission has released its latest Business and EU Consumer Confidence Survey. The November 2020 Flash Consumer Confidence Indicator which states that the estimate of the consumer confidence indicator decreased in both the euro area (2.1 points down) and the EU (2.2 points down) compared to October.
Consumer Confidence Indicator for EU and Euro Area is Down
At −17.6 points (euro area) and −18.7 points (EU), both indicators are well below their long-term averages of −11.2 (euro area) and −10.6 (EU).
The latest figures released by Statistics Canada shows that Canada Retail Sales rose 1.1% to $53.9 billion in September, the fifth consecutive monthly increase since the record decline in April.
Canada Retail Sales
Core retail sales, which excludes gasoline stations and motor vehicle and parts dealers, also rose 1.1%, on higher sales at general merchandise stores and food and beverage stores.
Retail sales were up, in volume terms, sales were up 1.1% in September.
Rounding out the third quarter, retail sales were up 22.6% compared with the second quarter. In volume terms, retail sales rose 21.5%.
Source: Statistics Canada, Retail trade, September 2020, November 20, 2020. Reproduced and distributed on an “as is” basis with the permission of Statistics Canada.
The figures from Australia Retail Sales showed that the seasonally adjusted estimate rose 1.6% ($460.5m) from September 2020 to October 2020.
Australia Retail Turnover Rose
It is also highlights that the seasonally adjusted terms, Australian turnover rose 7.3% in October 2020 compared with October 2019. Excluding Victoria, sales are 11.9% higher than October 2019.
Cafes, restaurants and takeaway food services led the rises, although there were also rises for Other retailing, and Clothing, footwear and personal accessory retailing. Household goods retailing was relatively unchanged, maintaining recent strength.
Victoria led the rises in all industries, except for Food retailing, as stores reopened throughout October. Victoria saw a rise of 5.2%, although it remains 5.7% below the levels of October 2019
NSW rose 1.6% after falls in August and September 2020. Western Australia led the rises in annual terms, with turnover 15.1% above October 2019.
Source: Australian Bureau of Statistics. (2020, November 20). Retail Trade, Australia, Preliminary. Australian Bureau of Statistics, Australian Government. Retrieved November 20, 2020. https://www.abs.gov.au/statistics/industry/retail-and-wholesale-trade/retail-trade-australia-preliminary/oct-2020
The data indicates that Public sector net borrowing (excluding public sector banks, PSNB ex) is estimated to have been £22.3 billion in October 2020.
The ONS stated that is “£10.8 billion more than in October 2019, which is both the highest October borrowing and the sixth-highest borrowing in any month since monthly records began in 1993” for for UK Public sector finances.
UK Public Sector Net Borrowing OCT: £22.3 billion
The UK Public Sector Net Borrowing shows the relationship between UK public sector monthly income and expenditure.
Central government bodies are estimated to have spent £71.3 billion on day-to-day activities (current expenditure) in October 2020, £6.4 billion more than in October 2019; this growth includes £1.3 billion in Coronavirus Job Retention Scheme (CJRS) and £0.3 billion in Self Employment Income Support Scheme (SEISS) payments.
Public sector net borrowing (PSNB ex) in the first seven months of this financial year (April to October 2020) is estimated to have been £214.9 billion, £169.1 billion more than in the same period last year and the highest public sector borrowing in any April to October period since records began in 1993.
Debt to GDP ratios levels last seen 1960’s
Public sector net debt excluding public sector banks (PSND ex) rose by £276.3 billion in the first seven months of the financial year to reach £2,076.8 billion at the end of October 2020, or around 100.8% of gross domestic product (GDP); debt to GDP ratios in recent months have reached levels last seen in the early 1960s.
General government net borrowing in the first seven months of this financial year (April to October 2020) is estimated to have been around 9.9% GDP.
The impact of the coronavirus on the public finances
The coronavirus (COVID-19) pandemic has had a substantial impact on public sector borrowing. Official OBR estimates (XLS, 201KB) published on 21 August 2020 indicate that the £214.9 billion borrowed by the public sector in the financial year-to-October 2020 could reach £372.2 billion by the end of March 2021.
Central government tax and national insurance receipts (combined) in the seven months-to-October 2020 fell by £38.3 billion (or 9.7%) compared with the same period in 2019, while government support for individuals and businesses during the pandemic contributed to an increase of £123.5 billion (or 28.5%) in central government day-to-day (or current) spending.
The extra funding required to support government coronavirus support schemes combined with reduced cash receipts and a fall in gross domestic product (GDP) have all helped push public sector net debt as a ratio of GDP to levels last seen in the early 1960s.
The ONS reported that there an increase of 5.8% year-on-year growth(YoY) rate for UK retails sales and that “the feedback from a range of businesses suggesting that consumers had started Christmas shopping earlier this year”.
The data is an estimate of retail sales in volume and value terms, seasonally and non-seasonally adjusted in Great Britain for October 2020.
UK Retail Sales Volumes Increased
Compared to last month, September, retail sales volumes increased by 1.2% which made it the sixth consecutive month of growth for the Retail Industry.
The ONS further reported the “total retail sales values (excluding fuel) increased by 7.9% when compared with February which was driven by a strong increase in sales online at 52.8% in comparison to reduced store sales at negative 3.3%” and that “growth in the volume of sales for non-store retailing at 6.4%, household goods stores at 3.2% and department stores at 3.1%”.
The Energy Information Agency (EIA) has provided data that shows 25% of America’s power plants can start up (going from being shut down to fully operating) within one hour.
Some power plants, especially those powered by coal and nuclear fuel, require more than half a day to reach full operations.
The time it takes a power plant to reach full operations can affect the reliability and operations of the electric grid.
The EIA post continued to inform that generator startup time differs across electricity-generating technologies because of the differences in the complexity of electricity generating processes, especially when starting again after all processes have been stopped (cold shut down).
EIA stated that most hydroelectric turbines, which use flowing water to spin a turbine, can go from cold start to full operations in less than 10 minutes. Combustion turbines, which use a combusted fuel-air mixture to spin a turbine, are also relatively fast to start up.
Steam turbines often require more time. A fuel heats up water to form steam, and that steam needs to reach certain temperature, pressure, and moisture content thresholds before it can be directed to a turbine that can spin the electricity generator.
The EIA reported that nuclear power plants use steam turbines, but these plants have additional time-intensive processes that involve managing their nuclear fuel. Almost all nuclear power plants require more than 12 hours to reach full operations.
The EIA says power plants that require more than 12 hours to start up are increasingly rare and only 4% of the generating capacity that came online from 2010 to 2019 requires more than half a day to reach full load.
We use cookies on our website to give you the most relevant experience by remembering your preferences and repeat visits. By clicking “Accept”, you consent to the use of ALL the cookies.
This website uses cookies to improve your experience while you navigate through the website. Out of these cookies, the cookies that are categorized as necessary are stored on your browser as they are essential for the working of basic functionalities of the website. We also use third-party cookies that help us analyze and understand how you use this website. These cookies will be stored in your browser only with your consent. You also have the option to opt-out of these cookies. But opting out of some of these cookies may have an effect on your browsing experience.
Necessary cookies are absolutely essential for the website to function properly. This category only includes cookies that ensures basic functionalities and security features of the website. These cookies do not store any personal information.
Any cookies that may not be particularly necessary for the website to function and is used specifically to collect user personal data via analytics, ads, other embedded contents are termed as non-necessary cookies. It is mandatory to procure user consent prior to running these cookies on your website.